How Lytica became a unique analytics company: Part 15
I repeatedly see an all too familiar shape. It is the shape of a transition between two plateaus, where the second is a step higher than the first. As I plot my customer’s competitiveness, starting from our first engagement, this shape becomes visible over time. The improvement in their performance is a direct result of acting on Lytica’s pricing recommendations and their renegotiation represents an assignable cause as their system has been changed by price visibility. The general shape has the lower plateau existing for one to two quarters, followed by two to three quarters of improving results with subsequent quarters being relatively stable at the improved level.
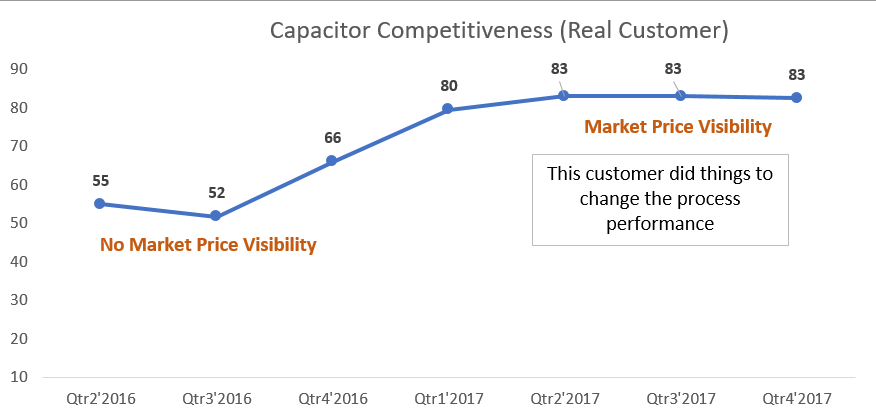
It is interesting to think about what caused the performance at the lower level and what is now causing or constraining it at the higher one. It appears that the customer’s purchasing process was in statistical control before using Lytica’s pricing information and has returned, albeit at a better level, after. The fact that the results are stable is good but why is it stable, and how can customers make another step function improvement?
This question is now on the minds of the researchers and developers at our Advanced Technology Center (ATC). We attribute price transparency as the cause of the improvement and believe it can produce a second – and maybe a third – one as more information is brought forward, and differences in team negotiating results are identified and ended. We also believe that changes to sourcing strategy and practices could unlock additional savings.
Our 2017 work in AI has resulted in a significant increase in our matched and priced component match rates. These gains will be visible to Freebenchmarking.com customers early this year and many Component Cost Estimator (CCE) users have already seen their value. The rate improvements in matching and pricing targets will aid clients in identifying more component outliers for repricing and hopefully cause a second performance gain. Our latest initiative of applying SPC techniques to individual component competitiveness levels will identify more systemic causes of pricing for the third improvement. Of particular interest are performance differences across commodities, negotiators and sourcing approaches.
It should be noted that the competitiveness levels in Freebenchmarking.com are based on component spending whereas in our SPC work we are only using the component’s price. This spend weighting in the competitiveness calculation is biased towards the component having the most impact on BoM cost.
As we have been looking at component level price normalization, it becomes apparent that many companies completely ignore the pricing of very low volume components. In our Freebenchmarking reports we have done the same, thinking that savings of $500 or less on an individual component were not worth chasing – or are they? Setting up a negotiation for savings at this level seems wasteful but, if there are 100 such components that could be easily identified, bundled and presented to a supplier, wasteful flips from being an adjective applied to overhead usage to one applicable to price. If one sets aside the price debate and looks only at these price points as data for a purchasing process assessment, the value of these low volume price data points increases. If you are already in a negotiation why not get pricing consistent with your competitiveness level across all components, regardless of volume. After all, Lytica has argued for some time that there is no correlation – and we have never found any – between price and volume at the component level; we only see it at the commodity spend level.
Histograms of individual component normalized prices (competitiveness) reveal interesting insights into the purchasing process and hint at opportunities that could lead to performance gains. Over time, we have identified more than 50 factors that influence pricing and traditionally we have argued that price prediction with an equation of these factors is futile. Now, using SPC techniques, we can compare commodities and look at the distribution within commodities to test speculations related to the importance of these 50 or so factors on a client’s price. This is getting at the heart of how organizations set up and leverage their innate potential for superior competitiveness (analogous with a boxer punching beyond their weight).
Today we are testing our assumptions using the files of some long-term customers who are interested in our study. Perhaps you would like to play in our sandbox as well? Let me know.
Ken Bradley is the Chairman/CTO & founder of Lytica Inc., a provider of supply chain analytics tools and Silecta Inc., a SCM Operations consultancy.