A company should expect to pay for a specific electronic device – a price commensurate with their Competitiveness within that particular commodity.
This Competitiveness is the measure of how the supply chain sees that company.
Ken Bradley, Founder & CTO Lytica Inc.
When Ken Bradley founded Lytica in 2005 as a consultancy practice, his primary areas of focus were setting up supply chains and price negotiations for Electronic OEMs.
From his varied background within Nortel Networks (Silicon Process Engineer, Operations Manager, President of China’s Guangdong Nortel JV and Nortel’s Chief Procurement Officer) Ken had always been intrigued with the science behind what drove “piece part pricing” of electronic devices. His intimate knowledge of silicon economics from running Nortel’s wafer manufacturing business along with his experience in practical costing techniques like ‘white sheet’ and ‘should cost’ modeling, led him to wonder if a Universal Law might exist that governed the price that a particular company would pay for an electronic component?
Fast forward 5 years – Ken, with his young SCM consultancy business, had a growing perspective of component pricing across multiple electronic OEM clients and observed an incredibly wide variance in the prices charged to different clients for the exact same components. He had the ideal laboratory to investigate whether a Universal Law of component pricing existed or could be modeled.
Discussions with subject experts from various disciplines within the component supply ecosystem (Component Manufacturers, Manufacturer Reps, Distributors, Product Managers, Brokers, EMS providers, OEMs and other consultants) provided insight on which variables influence the price of a device. Collective inputs included obvious ones such as volume, commodity spend, payment terms, channel mark-up and freight. Less obvious variables included the degree of VMI (vendor management inventory) programs, financial risk, inventory reservation levels and geography. Subject experts were also ardent about a set of mostly ambiguous variables such as an OEM’s cachet, their value (to the supplier) as a trend setter/early adopter, a device’s IP & degree of proprietary-ness, proximity of negotiations to suppliers’ quarter or year end and general strength of the overall relationship (business and social).
With such a plethora of variables, many of which were subjective, Ken drew the comparison between the complexity of predicting component pricing and weather forecasting. To paraphrase Steven Tracton, “the atmosphere is essentially non-predictable much beyond a 10-day time-frame, due in part to a scientific phenomenon called chaos (theory)”. Ken believed that there had to be another approach to accurately predict component pricing.
In lieu of a solvable Universal Law, Ken hypothesized that if he had a large enough repository of prices that customers actually paid for individual components he could model a database that would benchmark the prices of an OEM/EMS against all other customers who bought the same component (or a FFF equivalent). Further, he theorized that if an algorithm grouped these device benchmarks together for the client’s entire commodity the resultant measure would be a snapshot as to how the supply base viewed that OEM/EMS in the marketplace. His theory was that each company is unique in how their spend compares to their peers and other companies (just as each person’s DNA is unique). He defined this benchmark value as “Competitiveness”. For example, if Acme Inc. is found to have a 75th percentile Competitiveness for their Connector commodity spend this indicates that they buy their connectors (on average) at a more aggressive price 75% of the time than all the other clients within the database. Conversely, this same customer pays more then other clients – 25% of the time. Using this same methodology, commodity by commodity, would yield a competitiveness figure for each of a client’s commodities. Such a benchmarking algorithm would ultimately build an assessment of a client’s spend Competitiveness by commodity.
An analogy would be a student’s report card; if their math grade is 75%, a parent might expect subsequent math scores in the 72% to 78% range. Wide variance to this 75% grade in later tests would provoke either parental euphoria or concern. Considered still another way, this competitiveness assessment is a proxy for those multitudes of variables that supply chain participants described earlier as important in predicting prices of a specific component; a shorthand notation for how the collective supply ecosystem considers your company.
A powerful corollary of Ken’s hypothesis would suggest that if a customer’s price for a specific device was found to be a pricing outlier (unfairly priced) as compared to their Competitiveness assessment they could reasonably expect to renegotiate to a price commensurate to their other electronic components (within the same commodity).
With Ken’s hypothesis and software algorithms clearly defined, Lytica introduced Freebenchmarking.com (FBDC) to the world in 2010. FBDC’s analytic engine took a client’s costed BOM information and anonymously aggregated their unique price points to form statistical models. At the same time, a client’s spend was benchmarked, part-by-part AND commodity-by-commodity, against the database to calculate a Competitiveness level. In other words, a same basket of goods comparison (see Figure 1).
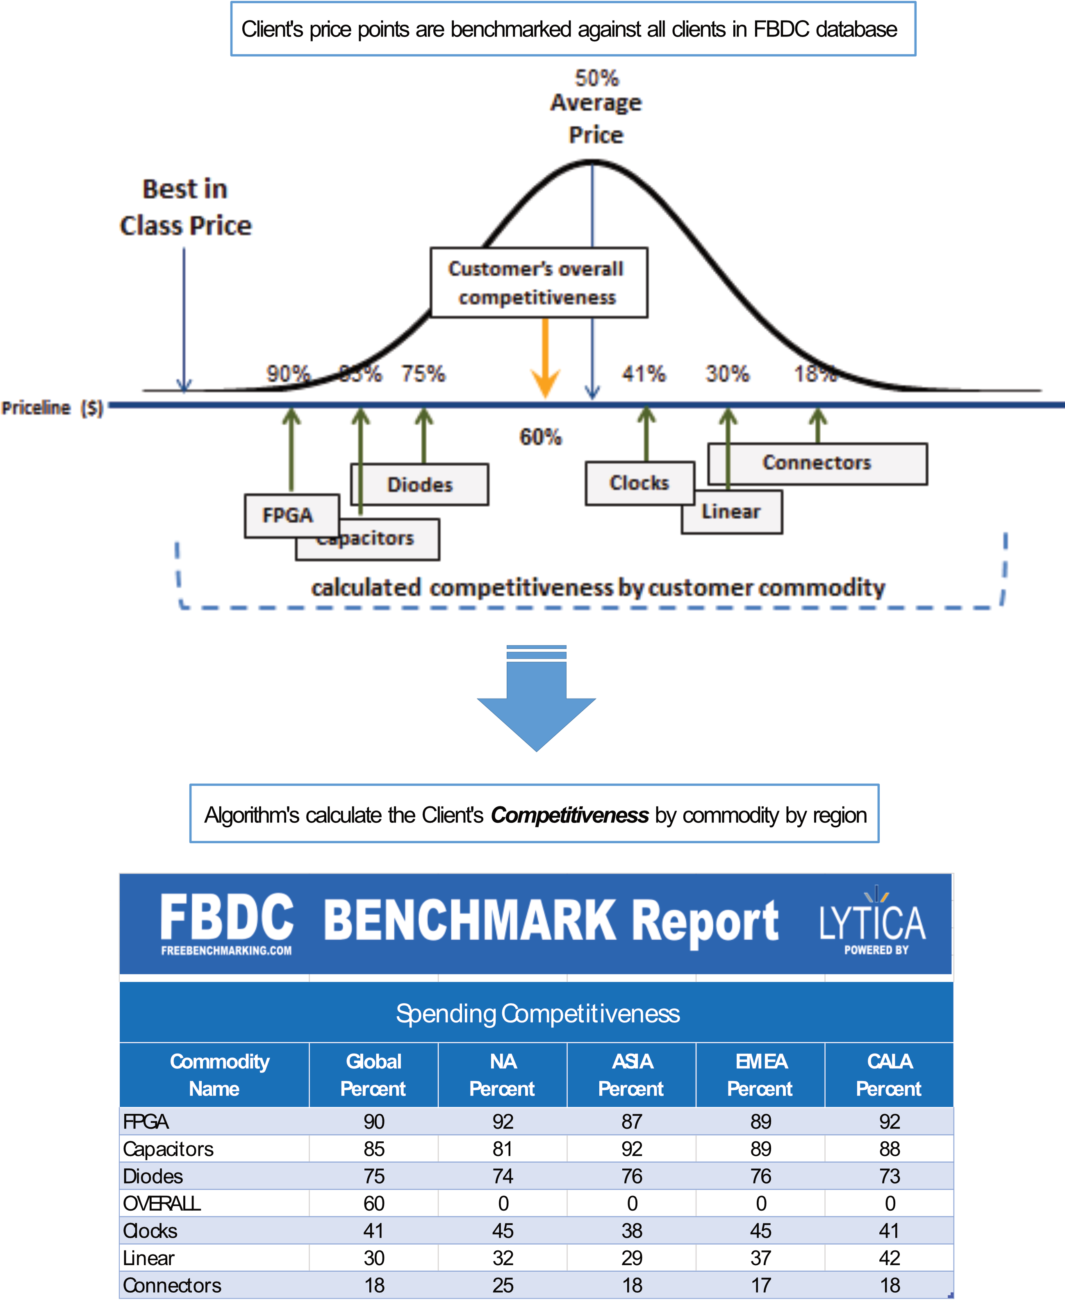
Figure 1 – A client’s Competitiveness by commodity is unique
Note: It is important to note that the FBDC database is comprised entirely of real customer pricing information. Distribution column pricing, manufacturer suggested pricing and internet aggregated pricing are not part of the FBDC database or used in any statistical models. Still today, that makes Lytica’s FBDC methodology unique.
The most impactful component of Lytica’s initial Freebenchmarking.com report was (and still is) Targeted Savings. At the heart of Ken’s original hypothesis, with the competitive assessment by commodity complete, FBDC sifts through those parts where a client is paying too much (pricing outliers) and calculates a target price that is appropriate for them. With this information in hand, Lytica clients can then go about renegotiating their prices to a realistic target (see Figure 2).
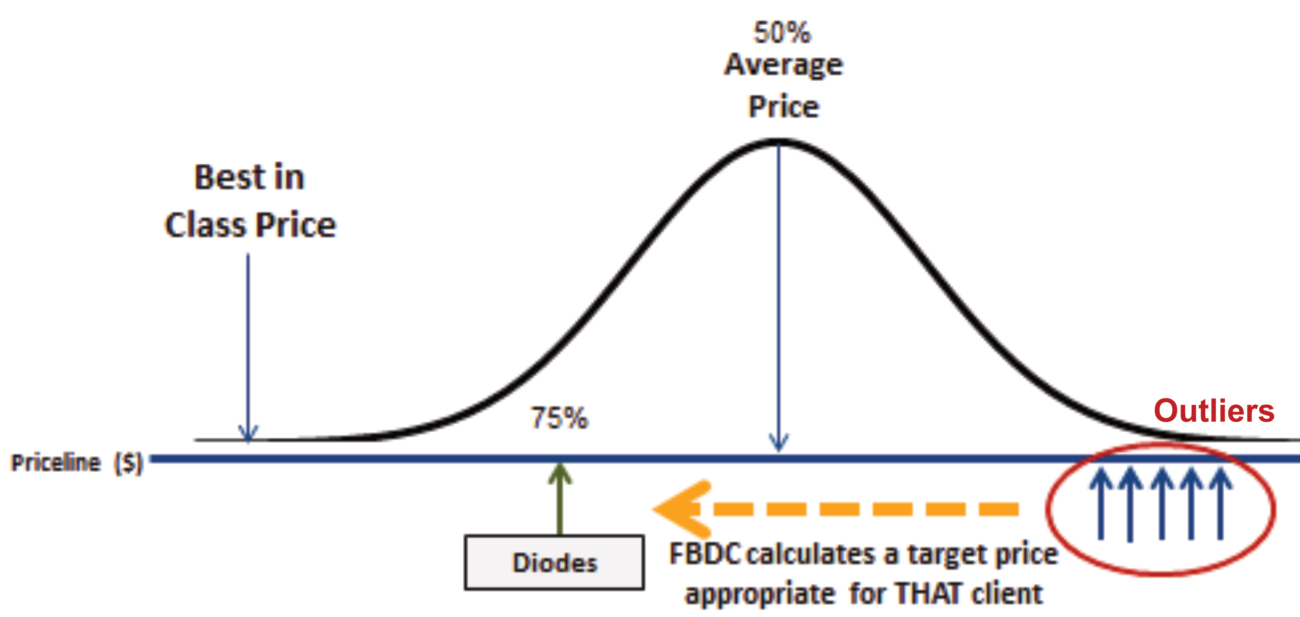
Figure 2 – Pricing Outliers are identified and Target Prices are calculated
The inception of Freebenchmarking.com in 2010 along with continued client success in saving hundreds of millions of dollars by negotiating prices close to their FBDC target pricing have proven Ken’s original hypothesis to be true. We now refer to it as:
A company should expect to pay for a specific electronic device – a price commensurate with their ‘Competitiveness’ within that particular commodity.
This ‘Competitiveness’ is the measure of how the supply chain sees that company.
Ken Bradley, Founder & CTO Lytica Inc.
We say to our clients, the only results that matter are your results. With years of algorithm innovation and a client base that includes some of the world’s largest and most sophisticated OEMs and EMS providers, Lytica stands proud of our founder’s innovative thoughts on electronic component price prediction.
Watch this space as I elaborate on other impactful corollaries that naturally fall out of Bradley’s Law and are being field proven every day.
By Mark Tayles – Lytica Inc. President/CEO